Notes and views on the major indicators as outlined in annual macroeconomic review 2009/10 of Nepal. A related excel file can be downloaded here.

● GDP growth rate 3.5%. Last year it was 3.9%
● Agricultural and non-agricultural sector growth 1.1% and 5.1%, respectively. Last year, they grew at 3% and 4.7%, respectively. The drag from agricultural sector was so strong that despite non-agricultural sector showing promising growth, overall GDP growth rate still is less than growth last year. Production of paddy and maize declined by 11% and 3.9%, respectively.
● Revenue mobilization amounted to Rs 179.95 billion, which accounted to 101.9% of annual budget estimate. Good news! Revenue/GDP = 15.2 (14.5 last year). Revenue slices: VAT Rs 53.46 billion, customs revenue Rs 35.3 billion, income tax revenue Rs 33.65 billion, and excise revenue Rs 24.31 billion. Non-tax revenue was Rs 25.28 billion, a decline by 4.3% as receipts of the government from principal, interest and dividend declined. Foreign cash grants increased by 1.9% to Rs 24.85 billion.
● Government expenditure increased by 20.2% to Rs 248.37 billion (Rs 206.69 billion last year), mainly due to growth in recurrent (Rs 144.38%, a rise of 20.7%) and capital expenditure (Rs 75.38 billion, arise by 20.2%)..
● Budget deficit/GDP is 3.3% (3.5% last year). Looking just at the figure, this is good, but note that there is less budget deficit due to low development expenditure. It was financed mainly by the issuance of securities worth Rs 29.91 billion, which is 2.5% of GDP. External cash borrowing was Rs 4.278 billion and net domestic borrowing was Rs 28.15 billion. Total outstanding debt amounts to Rs 157.86 billion.
● Gross consumption/GDP is 90.6 (0.3 percentage point increase from last year’s figure)
● Domestic savings/GDP is 9.4
● Gross capital formation/GDP is 38.2 (31.9 last year)
● Gross fixed capital formation/GDP is 21.3
● Gross national disposable income/GDP is 125.1 (126.4 last year during the review period).
● Annual average CPI was 10.5% in 2009/10 (13.2% in 2008/09). Food and beverage prices increased by 15.4% while non-food and services prices rose by 4.7%.
● Average salary index rose by 17.2% (15.3% increase last year)
● Merchandise exports down by 9.7% to Rs 61.13 billion (14.2% rise last year reaching Rs 67.70 billion). Exports to India declined by 2.2% (last year it increased by 6.4%). Exports to other countries declined by 21.3% as against a growth of 28.9% last year.
● Merchandise imports increased by 33.2% to Rs 378.80 billion (28.2% growth reaching Rs 284.47 billion last year). Imports from India grew by 34.2% (14.1% last year) and imports from other countries grew by 31.8% (53.4% last year).
● Trade deficit expanded by 46.5% to Rs 317.67 billion (33.3% rise to Rs 216.77 billion last year). BOT with India rose by 46.5% as compared to 17% last year. BOT with other countries increased by 46.7% compared to a growth of 62% last year. This is alarming. We need to do something urgent and possibly implement miraculous policy to boost exports or curb imports of luxury items. The widening BOT is simply unsustainable in a nation where population growth rate is close to the GDP growth rate and consumption rate is just ten percentage points shy of total GDP. Period.
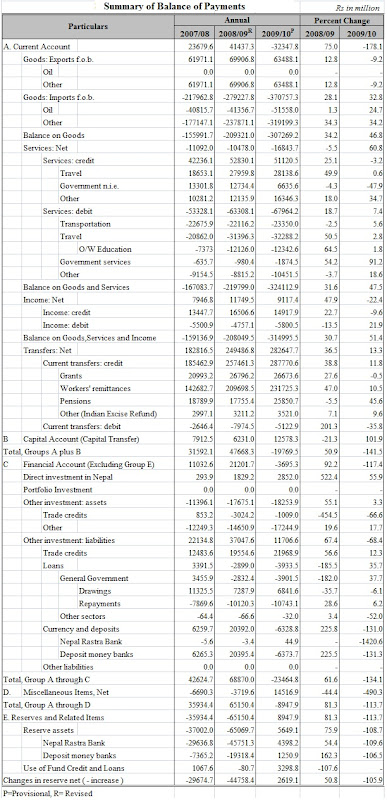
● Balance of payments (BOP) deficit was Rs 2.62 billion as against a surplus of Rs 44.76 billion last year. Current account deficit is Rs 32.35 billion as against surplus of Rs 41.44 billion last year. Trade deficit Rs Rs 317.76 billion, services trade deficit Rs 16.84 billion, transfer account surplus Rs 282.65 billion (last year Rs 249.49 billion surplus), workers’ remittances Rs 231.73 billion (growth of 10.5% compared to 47% last year), capital account surplus Rs 12.58 billion (Rs 6.23 billion last year), financial account deficit Rs 3.70 billion (Rs 21.20 billion surplus last year), FDI grew by Rs 2.85 billion (Rs 1.83 billion last year), and trade credit liabilities Rs 21.97 billion (Rs 19.55 billion last year).
● FDI commitment of Rs 9.1 billion (171 joint venture projects approved by DoI as against 230 projects with Rs 6.3 billion approved last year). Sector-wise new joint ventures: 50 in tourism, 72 in services, 37 in manufacturing, 1 in construction, 2 in agriculture, 5 in energy, and 4 in mining. It is expected to provide 7848 jobs. Investment commitment from India is highest, followed by Mauritius, Canada, and China. A total of 34 countries are given approval for foreign investment in this period.
● Foreign employment increased by 35.4% to 294094 (217164 last year). Employment in Malaysia stood at 113933, a 240.7% rise in comparison to the previous year. About 38.5% of total foreign employment is in Malaysia, followed by Saudi Arab, Qatar, and UAE. Qatar was the top recruiter of Nepalese employment seekers in 2008/09.
● Foreign exchange reserves dropped by 7% to Rs 266.57 billion in mid-July 2010 (Rs 286.54 billion during same period last year). It can fund merchandise imports of 8.6 months and merchandise and service imports of 7.3 months. NRs vis-à-vis US$ appreciated by Rs 4.85% between mid-July 2009 (US$1=NRS 78.05) and 2010 (US$ 1= NRS 74.44).
● M2 expanded by 14.5% (27.1% expansion last year). M1 expanded by 27.3% (11.2% expansion last year). Currency in circulation increased by 13%, demand deposits increased by 7.9%, and time deposits increased by 16.1%.
● Domestic credit expanded by 16.2% against last year’s expansion of 27.1%. Reasons: lower growth in private sector credit of the banking system.
● A total of 22 new banks and financial institutions came into operation in 2009/10: 1 commercial bank, 16 development banks, 2 finance companies, and 3 micro-finance institutions. In total: there are 27 commercial banks, 79 development banks, 79 finance companies, 18 micro-finance institutions, 16 NRB licensed cooperatives (undertaking limited banking transactions), 45 NRB licensed NGOs (undertaking micro finance transactions), and 25 insurance companies.
Incomplete comments (I will expand on these and others issues related to the report in later blog posts): The growth rate of exports has continued to decline while imports are surging, leading to a wide balance of trade deficit. Decline in exports to India due to low exports of readymade garments, zinc sheet, GI pipe, pulses and plastic utensils, among others. Exports to other countries declined in pulses, woolen carpet, readymade garments, pashmina and herbs.
Imports from India are increasing at a high rate. Major import products from India are petroleum, vehicle and spare parts, MS billet, chemical fertilizers, MS wire and rods, among others. These are moderately essential items in various sectors. So, do not expect the demand for these items to decline. In other words, given present trend, imports from India will continue to grow. From other countries, Nepalese consumers imported gold, telecommunication equipment and parts, polythene granules, silver and steel rod and sheet, among others. With exception to the import demand for gold, expect imports of other items from other countries to increase as well, unless the government curbs imports with high tariff.
The ratio of exports to imports is 16.1 (23.8 last year). As said earlier, this is simply unsustainable. We gotta do something about it. Blanket import-substitution policies are definitely not the way. Export promotion policies and encouraging consumption of domestically produced goods and services, wherever feasible, might be worth experimenting.
A rise in capital account surplus with a rise in trade credit liabilities led to narrowing down of overall BOP deficit. Generally, current account deficit matters in the overall BOP picture. We still have a huge current account deficit. So there should not be any respite that BOP deficit has narrowed down. Capital account reflects net change in national ownership of assets. Current account shows a nation’s net income, which matters for growth instead of capital account. A current account surplus increases a country's net foreign assets by the corresponding amount, and a current account deficit does the reverse. Interesting side note: When the news about BOP deficit of around Rs 20 billion was revealed in the first quarter, I had argued that this might narrow down when the full annual figure comes out. There was a huge concern that was, I think, overly blown up. Don’t get me wrong. BOP deficit has to be addressed, whatever small the deficit amount is. I was just saying that we need to wait for the overall yearly figure before stretching eyebrows to the max. Even the Economic Survey 2009/10 projected a BOP deficit of Rs 19.57 billion.
There is very low domestic savings. Consumption, which is fuelled by remittances, is increasing. GNDI is still high due to high remittances. GNDI is expected to increase by 18.1% against an increase of 24.5% last year. During the review period, the decline in remittances is seen as a decline in the ratio of GNDI to GDP. Still, it is expected to increase as the remittances sector starts to come back to normal after the global economic crisis.
More later on…