There has been quite an interest in interpreting the latest findings from UNDP’s Human Development Report, which, based on multidimensional poverty index (MPI), noted that of the 22 countries analyzed in the latest report, Nepal was the top performer in reducing MPI poverty. The MPI headcount poverty fell from 64.7% in 2006 to 44.2% in 2011, an astounding 4.1 percentage points decline per year. The latest survey used for this analysis was NDHS 2011.
From South Asia region, Bangladesh was another start performer with MPI poverty reduction of 3.4 percentage points per year between 2005 and 2010. The MPI poverty rate in South Asia is highest in Bangladesh (58%), followed by India (54%), Pakistan (49%) and Nepal (44%).
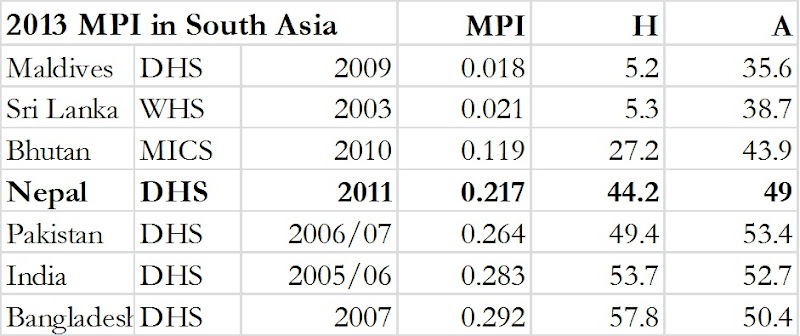
According to the latest HDR, while Sri Lanka is in the high human development group, Maldives, India and Bhutan are in the medium and the remaining ones in South Asia (Bangladesh, Pakistan, Nepal and Afghanistan) are in the low human development group. Nepal’s HDI value for 2012 was 0.463 (ranking was 157 out of 187 countries). Between 1980 and 2012, Nepal’s HDI value increased from 0.234 to 0.463, an average annual increase of about 2.2%. When HDI value of 0.463 is discounted for inequality, the HDI falls to 0.304, a loss of 34.2% due to inequality in the distribution of the dimension indices. The average loss in South Asia is 29.1%.
The MPI replaced the Human Poverty Index (HPI), which used country averages to reflect aggregate deprivations in health, education, and standard of living. However, incorporating ten indicators in these three broad categories, the multidimensional poverty index [MPI = incidence (deprived in at least one-third of the weighted indicators) * intensity (proportion of weighted indicators in which households are deprived)] captures overlapping deprivations (prevalence) and deprivations on average (intensity). It also can be used to compute depravations using disaggregated data at the sub-regional level.
The education (years of schooling and school attendance) and health dimensions (nutrition and child mortality) are based on two indicators each while the standard of living dimension is based on six indicators (cooking fuel, sanitation, water, electricity, floor and asset ownership). A person is multidimensionally poor if the weighted indicators in which he or she is deprived add up to at least 33.3%. Households with a deprivation score greater than or equal to 20% but less than 33.3% are vulnerable to or at risk of becoming multidimensionally poor.
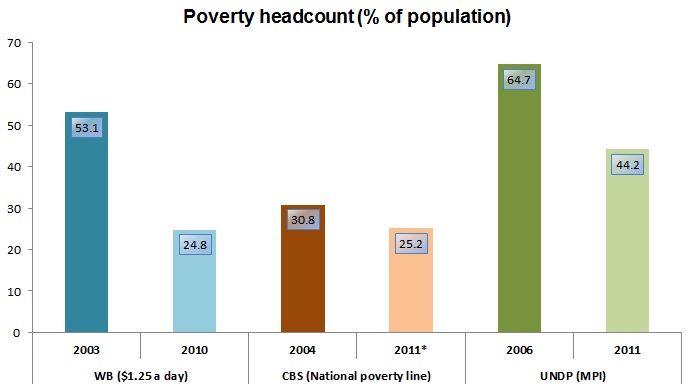
The MPI headcount differs substantially from CBS’s and WB’s poverty estimate. This is because the last two estimates are based on (consumption based) monetary measures, but the MPI is based on ten indicators that reflect multidimensional deprivations. It requires a household to be deprived in multiple indicators at the same time. The MPI shows the interconnectedness among deprivations and combines several MDG indicators into a single measure. So, while 44.2% of the population lived in MPI poverty, an additional 17.4% were vulnerable to multiple deprivations. [Note that the * sign adjacent to 2011 for CBS’s data refers to the change in consumption aggregates used to compute poverty. Without this one, the poverty rate fell even steeply. See this blog post.]
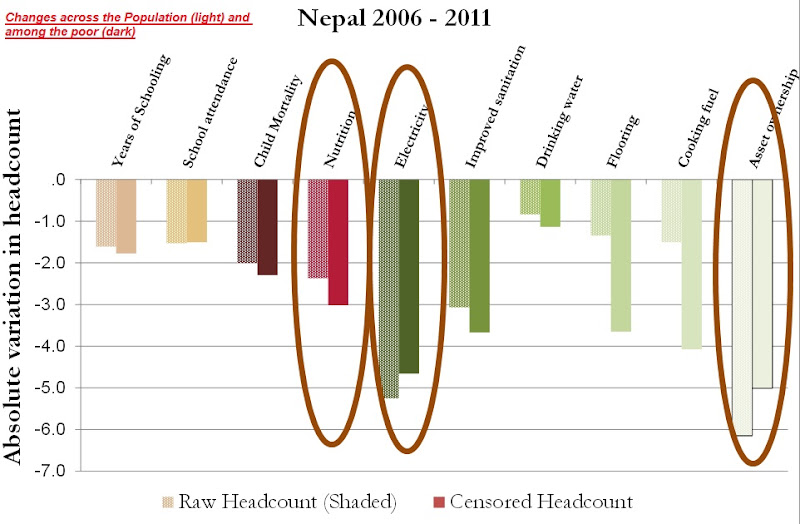
The point here that whatever measure of poverty you look at, there has been a substantial reduction in poverty and as a share of population, headcount poverty rate is not the highest in Nepal (when compared to other countries in the region). For more on national poverty line, see this blog post. The explanatory story also remains more or less the same, i.e. remittances backed reduction along with provision (mostly access) of basic necessities. The MPI shows that improvement in asset ownership, electricity and nutrition contributed the most in reducing poverty (both among overall population as well as among poor only).
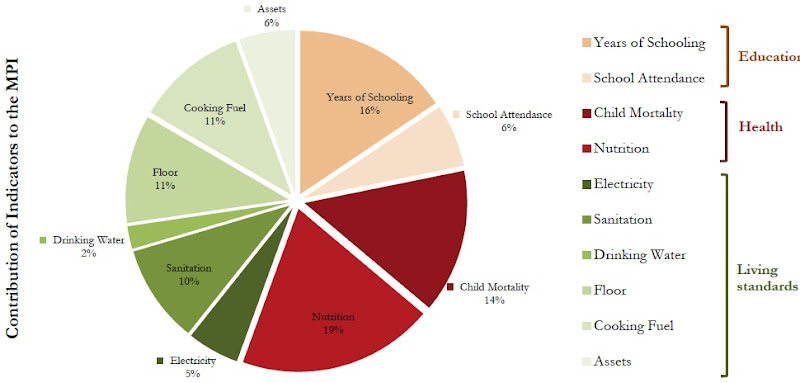
The pie chart below shows the contribution of different indicators to the MPI. Nutrition followed by years of schooling child mortality, cooking fuel, sanitation and assets among others had the largest contribution (not in reduction in poverty but in pushing households below poverty line).
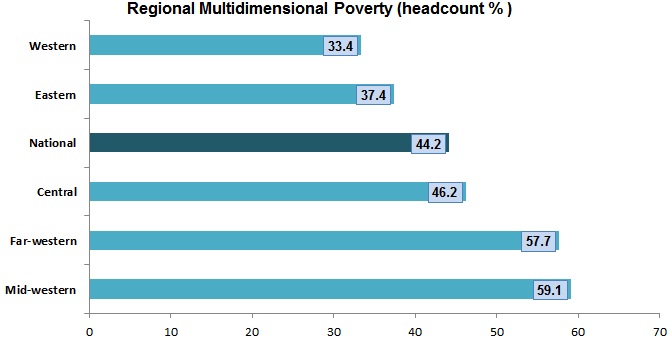
Region-wise breakdown shows that MPI poor (% of regional population) was the lowest in Western region and highest in Mid-western and Far-Western. Western and Eastern regions had MPI poor below the national average.
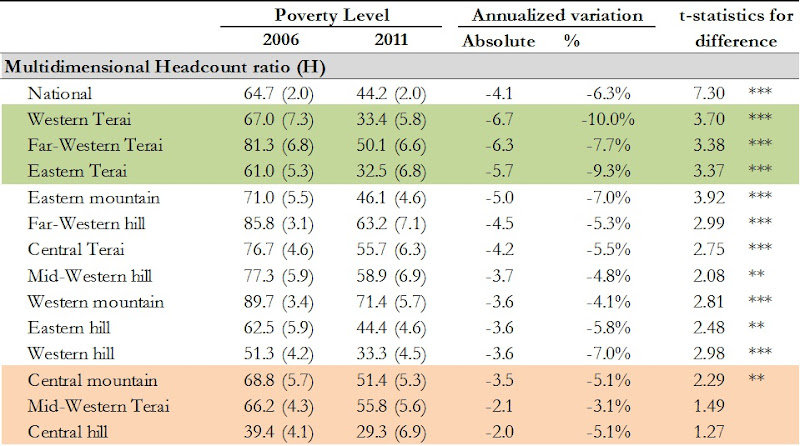
Further sub-regional breakdown reveals a surprising trend: Terai region reduced poverty the most. The figure below ranks regions from poorest (far left) to least poor (far right) and shows the rate of poverty reduction of each region between 2006 and 2011. Far-Western Terai region (even though fourth in terms of MPI headcount poverty when compared to all sub-regions) saw the largest rate of poverty reduction. It is followed by Western Terai and Central Terai. Central Hill and Mid-Western Terai reduced multidimensional poverty the least.
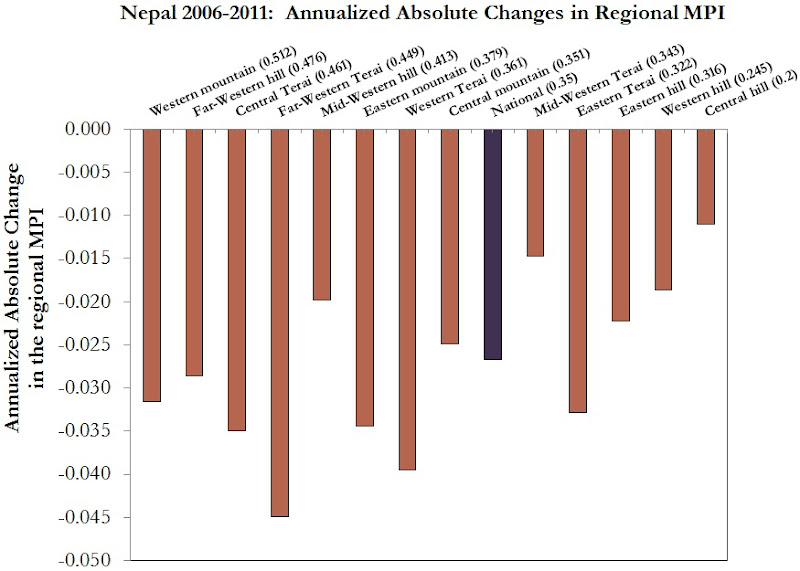
Western Terai more than halved its poverty rate (67% in 2006 to 33.4% in 2011). Far-Western Terai and Eastern Terai also achieved significant reduction in poverty rate (from 82.3% to 50.1% and from 61% to 32.5% respectively). Headcount poverty in Western Terai, Eastern Terai, Western Hill, and Central Hill was lower than the national average of 44.2%.
Before closing off this long post, few things to keep in mind:
- The MPI supplements $1.25 a day and national poverty measures by looking at deprivations across 10 indicators. It is not one versus the other.
- All three measures of poverty show a drastic decline in poverty.
- The outstanding performance (regional comparison) of Nepal may not remain so in the days ahead because survey data for all countries was not for uniform time period. As new survey data are available, the relative position of Nepal might also change. But, still the story is that there has been a drastic reduction in poverty.
- Improvements in asset ownership, access to electricity and better nutrition contributed the most to reduction in poverty. The role of remittances in all of these is loud and clear. Rural roads (leading to price reductions), increase in rural wages, social expenditure, vibrant civil society and active women's participation are also stressed upon.[Still, since nutrition followed by years of schooling child mortality, cooking fuel, sanitation and assets are the factors keeping poor people poor, the policy focus should be on improving access to and availability of these basic services.]
- Sub-regional poverty analysis shows that largest multidimensional poverty reduction occurred in Terai region.